Washington ranks third in a ConsumerAffairs ranking of the states most burdened by grocery costs. Households in the state spend an estimated $11,347 a year on...
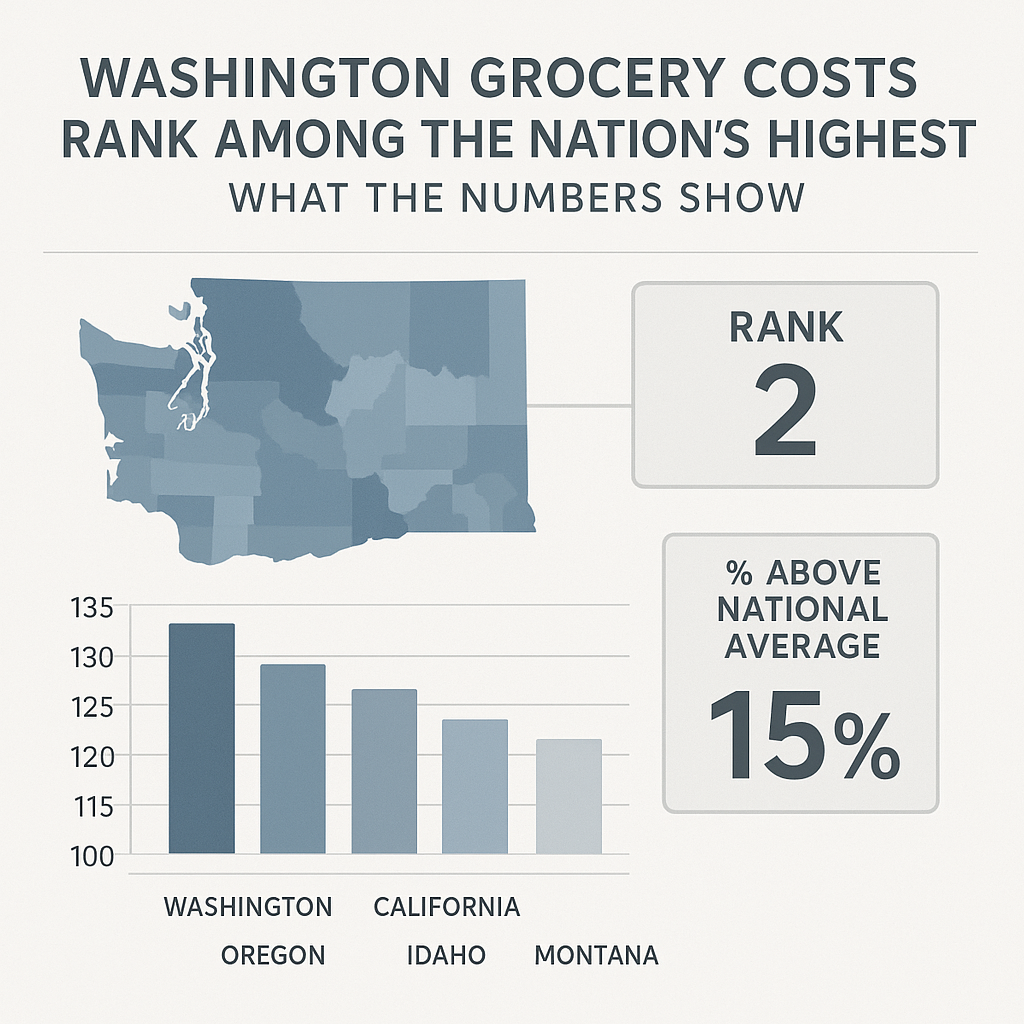
Washington ranks third in a ConsumerAffairs ranking of the states most burdened by grocery costs. Households in the state spend an estimated $11,347 a year on groceries—the highest total in the country—while grocery spending amounts to 11.4% of median household income, which the ranking puts near $99,400.
The figures point to two different measures that are easy to blur together: the dollar amount a household spends, and the share of household income that spending represents. Washington leads on the first measure, but Arkansas has the highest reported burden as a share of income, at 11.7%. The distinction matters because a large grocery bill does not automatically mean the largest income squeeze.
ConsumerAffairs says it used census and U.S. Department of Agriculture data to estimate annual grocery spending for an average-size household in each state, then compared those estimates with each state’s median household income. The ranking also cites a 1.8% nationwide rise in grocery prices over the 12 months ending in September. That is useful context, but it does not explain why Washington’s total is so high or identify which households feel the greatest strain.
What Is Washington’s Grocery-Cost Burden?
A grocery-cost burden is a comparison between estimated grocery spending and household income. In the ConsumerAffairs ranking, Washington’s burden is reported as 11.4% of median household income. In practical terms, the figure says that the estimated annual grocery bill takes up a larger slice of the state’s typical household income than it does in most states. It is not a measure of every family’s budget, nor does it say that every Washington household spends that exact share.
The other headline number is $11,347. That is the ranking’s estimate of annual grocery spending for an average-size Washington household, and ConsumerAffairs says it is the highest state total in the nation. The per-person estimate is roughly $4,600 a year, compared with about $3,200 nationally. Those measures are related, but they are not interchangeable: household size and the way household-level spending is estimated affect how the totals compare.
The ranking places Washington third in overall grocery-cost burden. Arkansas is first, at 11.7% of median household income, and Maine is second. Louisiana and Hawaii round out the top five. Oklahoma sits at the other end of the ranking, with a reported grocery burden of 6.8%. The national estimate is 9.8%, according to ConsumerAffairs.
That spread is a reminder to read the label on each statistic. “Highest spending” describes the dollars estimated for a household. “Most burdened” describes the share of income absorbed by that spending. Washington can lead the first category while trailing Arkansas on the second because the two states’ reported income levels differ. The ranking gives Washington’s median household income as nearly $99,400; it does not provide an Arkansas household spending total in the figures reported here.
When I compare the measures, the distinction—not the ranking position by itself—is the most useful point. A high-income state can still have a heavy household expense, while a lower dollar total can weigh more heavily on households with less income. That is why the median-income comparison belongs beside the grocery bill, not in a footnote.
The method has limits. A statewide median is a midpoint, not a portrait of every household, and an average-size household is a statistical construct. The ranking does not show individual receipts, food choices, local prices, or how many residents rely on assistance. Those gaps do not erase the comparison; they do set boundaries around what it can prove.
Core Details and Context
The central finding is plain: Washington households have the highest estimated annual grocery spending in the ranking, while the state ranks third when spending is measured against median household income. ConsumerAffairs gives the annual household figure as $11,347 and the income share as 11.4%. These numbers are the backbone of the headline, but the surrounding comparisons explain what they do—and do not—say.
- Washington’s total is the largest. ConsumerAffairs estimates $11,347 in annual grocery spending for an average-size household in the state. No other state in the ranking is reported to have a higher dollar total. That is a statement about estimated spending, not a claim that every Washington family pays more than every family elsewhere.
- Arkansas has the highest income share. Its reported burden is 11.7%, compared with Washington’s 11.4%. The national estimate is 9.8%. A gap of a few tenths of a percentage point may look modest, but it changes which state ranks first under this particular measure.
- The Washington per-person figure is also elevated. The ranking puts annual grocery spending at roughly $4,600 per resident, against about $3,200 nationally. Those are approximate comparisons, and the source does not give a detailed breakdown of how the per-person estimate was derived.
- Bills rose sharply in dollars for Washington households. From 2024 to 2025, the estimated grocery bill for an average-size household increased by $430. ConsumerAffairs says that was the largest dollar increase of any state. The ranking does not say that Washington had the largest percentage increase.
- The national figures provide a separate yardstick. ConsumerAffairs estimates that an average-size U.S. household spends nearly $670 per month, or more than $8,000 annually, on groceries. It also estimates a 2.3% rise in national per-person grocery spending from 2024 to 2025 and a rise of more than 33% from 2019 to 2025, equal to about $1,733 more a year for a typical household.
The ranking links its calculation to census and USDA data. The Census Bureau’s American Community Survey data portal is a source for household and income statistics, while the USDA’s monthly food-plan reports provide published estimates of food costs. Those resources offer useful context for the kinds of inputs used in food-budget analysis; they should not be mistaken for a second confirmation of ConsumerAffairs’ state rankings.
Price inflation is another piece of context, but it is not the same thing as a household’s total bill. The Bureau of Labor Statistics tracks changes in consumer prices through its Consumer Price Index releases. ConsumerAffairs, citing the BLS, says grocery prices nationwide rose 1.8% over the 12 months ending in September. A price index measures change over time; it does not directly tell a reader how much a particular household bought or paid.
Frankly, the most tempting explanation—“prices went up, so that explains the whole ranking”—is too simple. The figures show spending, income shares, and changes over time, but they do not isolate causes such as local retail prices, household size, product mix, or shopping habits. ConsumerAffairs’ results establish a comparison. They do not settle every question about why the states differ.
Timeline: How the Ranking’s Findings Fit Together
The figures cover several periods and several kinds of comparison. Keeping those periods separate prevents a common mistake: treating a one-year price change as though it explains a multiyear spending trend or a state’s position in a ranking.
- 2019 to 2025: the longer national comparison. ConsumerAffairs estimates that national grocery spending rose more than 33% per person over this span. It says that increase left a typical household paying about $1,733 more annually. That is a cumulative comparison, not an annual inflation rate.
- 2024 to 2025: a national per-person increase. The platform estimates a 2.3% rise in national grocery spending per person. It separately reports that Washington households’ annual bills rose by $430, the largest dollar bump among states. One is a national percentage change; the other is a state-specific dollar change.
- The 12 months ending in September: grocery-price inflation. The ranking cites the BLS figure of 1.8% for the nationwide increase in grocery prices during this period. The source does not specify the exact year in the figures reported here, so the date should be read as the period named in the ranking, not assigned an unsupported calendar year.
- The annual household estimate: state spending compared. ConsumerAffairs used census and USDA data to estimate annual grocery spending for an average-size household in each state. It compared those estimates with each state’s median household income. That comparison produced Washington’s $11,347 total and 11.4% share.
- The ranking: states ordered by burden. Arkansas ranks first at 11.7%, Maine second, and Washington third at 11.4%. Louisiana and Hawaii are fourth and fifth. Oklahoma records the lowest reported burden, 6.8%.
When I line up those periods, the $430 Washington increase stands out—but it should not be confused with the state’s full annual spending estimate. The increase describes a year-to-year change; $11,347 describes an estimated annual level. Likewise, a 1.8% price increase is not the same as a 2.3% increase in estimated spending per person. Price movement and spending movement can differ because the measures capture different things.
That distinction is basic, yet it is often lost in headlines. A larger bill might reflect higher prices, a different quantity of groceries, a different mix of products, or some combination. The reported figures do not break down those components. The timeline tells readers when the comparison applies; it does not supply a causal account that the ranking itself does not contain.
Comparison Table: Washington, Arkansas, and the National Figures
Washington’s closest comparison in the ranking is Arkansas, the state with the highest grocery burden as a share of income. The table keeps the available figures side by side and marks data that are not reported here rather than filling the blanks with guesses.
| Measure | Washington | Arkansas | United States |
|---|
| Grocery-burden rank | 3rd | 1st | — |
| Grocery spending as share of median household income | 11.4% | 11.7% | 9.8% |
| Estimated annual household grocery spending | $11,347 | Not reported in the ranking figures cited here | More than $8,000 |
| Estimated annual grocery spending per person | Roughly $4,600 | Not reported | Roughly $3,200 |
| Median household income | Nearly $99,400 | Not reported | Not reported here |
| 2024–2025 change | Up $430 per average-size household; largest state dollar increase | Not reported | Per-person spending up 2.3% |
The table shows why a one-column headline can mislead. Washington’s spending estimate is the largest, but Arkansas’ income share is higher. The states are being compared through an affordability ratio, not ranked solely by the amount on a grocery receipt. That distinction is the difference between “most dollars spent” and “largest portion of income used.”
The national figures add a baseline, not a direct substitute for either state. ConsumerAffairs estimates an annual U.S. household grocery bill of more than $8,000 and a national income share of 9.8%. The annual dollar figure is expressed as a rounded amount, while Washington’s is reported precisely to the dollar. Readers should not treat that difference in precision as evidence that one estimate is inherently more exact than the other.
Nor does the table establish that every Washington household is worse off than every Arkansas household. Median income hides the range of incomes above and below it; average-size household estimates likewise cannot capture household-specific budgets. A single parent, a couple, and a larger family do not buy the same basket or face the same monthly total. The ranking does not provide those household-level comparisons.
Here’s the kicker: ranking systems reward a clean ordering, while real household finances are messy. A statewide percentage is a helpful signal for comparison, not a diagnosis for a particular family. The fair reading is narrower and more useful: by ConsumerAffairs’ method, Washington has the highest estimated household grocery total, Arkansas has the highest reported income share, and both figures sit above the national burden estimate.

Common Misconceptions and What to Know
Misconception: Washington is number one because it is the most burdened. It is not, according to this ranking. Washington has the highest estimated annual household grocery spending, but Arkansas has the highest burden as a share of income. Washington ranks third in that comparison, behind Arkansas and Maine. The words “highest spending” and “most burdened” describe different measurements.
Misconception: High median income cancels out a high grocery bill. The ranking says Washington’s median household income is nearly $99,400, yet grocery costs still take up 11.4% of that figure. A higher income can change the proportion, but it does not make a large recurring bill disappear. Nor does a state median tell us how much room any one household has after housing, utilities, transport, health expenses, and other bills.
Misconception: The $430 increase means prices rose by that amount for every household. ConsumerAffairs describes a $430 increase in the estimated bill for an average-size Washington household from 2024 to 2025. It is not a promise that every family’s own grocery spending rose by exactly $430, and it is not identified as a percentage increase. Household purchases vary; the ranking reports a state-level estimate.
Misconception: The BLS price figure and the ConsumerAffairs spending figure measure the same thing. They do not. The 1.8% figure cited by ConsumerAffairs describes nationwide grocery-price inflation over a 12-month period ending in September. The $11,347 estimate describes annual spending for an average-size Washington household. One tracks a change in prices; the other is a spending estimate. A household’s bill can change for reasons beyond the price index alone.
Misconception: A state ranking explains the cause of high costs. Not by itself. The reported method compares estimated spending with median income, using census and USDA data. The reported figures do not identify the contribution of local store prices, transport costs, wages, rent, shopping patterns, or household composition. Those may be reasonable subjects for further reporting, but they are not findings established by the figures here.
There is also a practical point that deserves more than a footnote. Food is not an optional luxury for households, and access to it bears on human dignity and the stewardship of family resources. A useful public discussion should therefore look beyond the tidy statewide rank: it should ask which groups face the tightest budgets, what local data show, and whether policy responses improve access without pretending that one statistic answers everything.
Skepticism is warranted in both directions. A high ranking is not proof of a crisis for every resident, and a high median income is not proof that grocery costs are painless. The figures offer a strong reason to examine Washington’s household costs more closely. They do not justify sweeping claims about every family or a single cause.
Frequently Asked Questions
Why does Washington rank third if it has the highest grocery spending?
The ranking uses more than one measure. Washington has the highest estimated annual household grocery spending, at $11,347, but its burden is calculated as spending relative to median household income. Arkansas records the highest share, 11.7%, while Washington is at 11.4%. Washington therefore ranks third by the burden measure even though it ranks first by estimated household dollars.
How much do Washington residents spend on groceries per person?
ConsumerAffairs estimates roughly $4,600 per person each year in Washington. The national comparison is about $3,200 per person. These are approximate figures from the ranking, not a statement that every resident spends the same amount. The reported figures do not include a household-by-household distribution.
How much did Washington grocery bills rise from 2024 to 2025?
The ranking estimates an increase of $430 for an average-size Washington household. ConsumerAffairs says this was the largest dollar increase among states. It does not report that every household experienced the same rise, and the $430 amount should not be mistaken for a percentage change.
What is the national grocery-cost burden?
ConsumerAffairs reports a national grocery burden of 9.8% of median household income. It also estimates that an average-size U.S. household spends nearly $670 per month, or more than $8,000 per year, on groceries. Those are distinct national measures: one is an income share, and the other is an estimated spending amount.
Final Thought
Washington’s ranking deserves attention, but it deserves careful reading, too. The state leads the country in ConsumerAffairs’ estimate of annual household grocery spending, at $11,347, and its households saw the largest reported dollar increase from 2024 to 2025. Yet Arkansas, not Washington, has the highest grocery burden as a share of income. The distinction is not a technical quibble; it changes what the headline means.
The ranking gives readers a useful snapshot: Washington’s estimated per-person spending is about $4,600, compared with roughly $3,200 nationally, and its 11.4% income share exceeds the national estimate of 9.8%. It also places the result alongside a longer national rise in grocery spending since 2019. But a snapshot cannot stand in for household-level evidence. The estimates do not show who is skipping purchases, whose costs rose fastest, or what local conditions account for the state’s position.
That is where the next round of reporting should go. Statewide averages can flag pressure; local price data and household budgets can show where it lands. Policymakers, employers, grocers, and community organizations should be judged by whether their decisions protect access to basic food and use resources responsibly—not by whether they can quote a rank. A number can open the conversation. It cannot finish it.