Why U.S. School Enrollment Is Falling in Some Districts—and What the Numbers Really Show
School enrollment is falling in many places, but the national picture is not a simple downward slide. “School districts across the United States are seeing enrollment declines,” Beth Doglio said. “It’s not just here.” That observation points to a real pressure facing some communities; it does not, on its own, tell us which districts are losing students, how quickly, or why. National data show changes shaped by birth rates, household moves, school choice, and the disruption of the pandemic—and those forces do not affect every district alike.
The quote attributed to Doglio does not include a date, district, or policy debate, so it should not be treated as evidence about a particular school system. The broader issue is clear enough: communities and school boards are trying to understand whether enrollment losses are temporary, structural, or both. I examined the available national data and reporting; the plain answer is that some districts are shrinking, some are recovering from pandemic-era losses, and others are growing. The difference matters. A district that misreads a short-term dip as permanent may close schools unnecessarily; one that treats a lasting decline as a blip can make a budget crisis worse.
What Is a School Enrollment Decline?
A school enrollment decline means fewer students are registered in a school system or a particular set of schools than during an earlier comparison period. The definition sounds straightforward. The measurement is not.
A district might compare this September with last September, the current school year with a pre-pandemic year, or a five-year average. Each comparison answers a different question. A one-year fall can reflect a temporary change—families moving, a delayed kindergarten start, or a data-counting issue. Several consecutive years of lower enrollment suggest a more durable shift, though even then the causes need to be examined rather than guessed at.
There is also a difference between public-school enrollment, total enrollment across public schools, and the number of school-age children living in a district. Those totals can move in opposite directions. A community may have more children but fewer enrolled in its district schools if more families choose private schools, charter schools, homeschooling, or another public district. Conversely, a district’s enrollment can rise because families move in, even if the total number of children nationally is flat or falling.
National figures offer useful context, not a verdict on any one community. The National Center for Education Statistics’ public-school enrollment data track enrollment over time and show why the comparison year matters. NCES reported a substantial pandemic-era disruption in public-school enrollment, followed by changes that varied by grade and location. A national total cannot establish what happened in Doglio’s district—or even confirm that her remark concerned Washington state—because the supplied quote does not identify the place or date.
I would be wary of headlines that turn “some districts are shrinking” into “American schools are emptying.” That is a much broader claim. The careful question is: which students are missing from which schools, compared with when, and where did they go? Those answers shape staffing, transportation, special education, and the use of school buildings. They also shape public trust. Families deserve figures they can check, not a dramatic label pasted over a complicated local count.
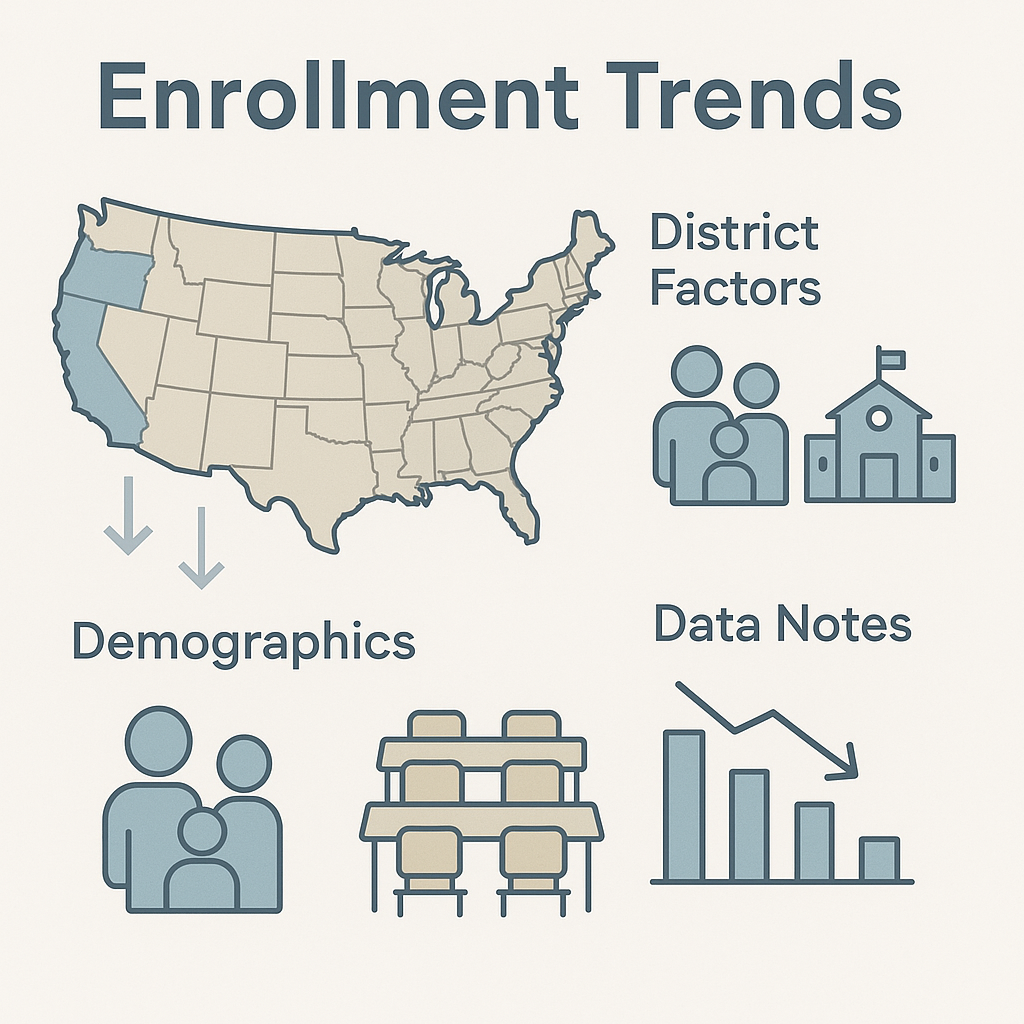
Core Details and Context
Enrollment is not just a school statistic. It affects the operating budget, class sizes, bus routes, staffing, and the way a district uses buildings. But a headcount does not automatically dictate what should happen next. School finance formulas differ by state, costs do not fall in proportion to student numbers, and a district still has obligations to children who require specialized services or live far from the nearest school.
Several forces can overlap:
- Birth rates and the age profile of a community. Fewer births today can mean smaller kindergarten classes several years later. The timing is gradual, and it varies by county and neighborhood. Birth trends help explain a change; they do not tell a district exactly how many students will arrive at each school.
- Migration and housing. Families move for work, housing, caregiving, or other reasons. Rising rents can push households with children away from a city while new apartment construction may bring families into another area. Local enrollment can shift quickly when housing changes.
- School choice and alternative arrangements. Students may attend charter or private schools, learn at home, or enroll in a different district. These choices can change public-school counts without changing the number of children in the community. The U.S. Census Bureau’s account of pandemic-era school enrollment describes how participation patterns changed during the pandemic, including a fall in public-school enrollment in the 2020 period.
- Pandemic disruption and delayed entry. School closures, remote learning, family health concerns, and the difficulty of enrolling young children altered school participation. Some families returned later; others kept a new arrangement. A temporary shock can leave a longer statistical shadow.
- District boundaries and grade transitions. A citywide total can hide a decline in one elementary area and growth in another. Students moving from elementary to middle school also create predictable shifts, while boundary changes can make year-to-year comparisons less clean.
Here’s the kicker: enrollment and funding are related, but they are not interchangeable. Some states allocate substantial operating funds according to student counts; others combine enrollment with staffing, property taxes, categorical grants, or other measures. Funding may lag behind enrollment, and districts often face fixed expenses—heating a building, maintaining a bus fleet, or providing legally required services—that do not shrink neatly when a class is smaller.
The consequences can be serious. If enrollment falls and revenue follows, leaders may consider reducing positions, combining programs, changing attendance zones, or closing buildings. Each choice affects real people. A school closure can lengthen a child’s commute, weaken a neighborhood institution, and disrupt relationships with teachers. Keeping every building open at any cost can also divert money from classroom instruction or support services. There is no painless option, which is why the public needs transparent assumptions and a fair process.
The moral test is not whether a budget spreadsheet balances on paper. It is whether the decisions respect students’ dignity, distribute burdens fairly, and serve the common good—especially for children with disabilities, students learning English, and families with few transportation options. That is not sentimentality. It is the basic work of public education.
Timeline: How Enrollment Shifts Become a District Budget Problem
- A student count changes. Districts count enrolled students at particular times, under state rules that vary. Some systems use multiple counts or average enrollment; others rely more heavily on a snapshot. A falling count deserves a closer look before anyone announces a permanent trend.
- The district compares the right periods. Leaders should review several years, separate grade levels, and compare schools with similar boundaries. Pandemic-era years require special care because attendance, family choices, and school operations were unusually disrupted. When I analyze a trend, I look for both the change in total enrollment and the pattern beneath it.
- The finance formula translates—or delays—the change. A student decline may affect revenue next year, over several years, or only partly. State policy matters. So do grants, local taxes, special-education obligations, and the district’s reserve funds. Claims that each lost student means an immediate, identical loss of dollars are usually too crude.
- Costs catch up with the count. Staff contracts, building maintenance, transportation, food service, and special programs do not automatically reset when enrollment falls. A district can therefore face a squeeze: less revenue on one side, largely fixed expenses on the other. Cutting too quickly may damage instruction; waiting too long can exhaust reserves.
- Officials decide what to change. Options may include adjusting boundaries, sharing services, reducing administrative costs, consolidating classes, or closing a school. These are policy decisions, not mechanical outcomes of a spreadsheet. Each option has different effects on access, safety, commute times, and community life.
- Families respond, and the count changes again. A closure or boundary shift may prompt families to leave the district, while improved programs or new housing can attract them. Public confidence matters. A decision made without credible consultation can accelerate the very enrollment loss officials hoped to manage.
- The district checks whether its assumptions held. A responsible board publishes the actual enrollment, compares it with forecasts, explains deviations, and revises the plan. Forecasts are estimates, not promises. Treating them as settled fact is a recipe for avoidable conflict.
Most coverage jumps from the first step to the fifth: enrollment fell, therefore a school must close. That skips the hard work. A good timeline includes the finance rules, the alternatives, the students most affected, and the evidence that would change the decision. It also gives families enough time to respond before a board votes.
Comparison: Declining-Enrollment Districts and Growing-Enrollment Districts
The most useful comparison is not between one district and a supposed national average. It is between the pressures faced by districts losing students and those adding them. The broad comparison below describes common planning issues; it is not a claim that every district in either group experiences the same outcome.
| Issue | Districts with declining enrollment | Districts with growing enrollment |
|---|
| Student counts | Total or grade-level counts fall over one or more years | Total or grade-level counts rise over one or more years |
| Common pressure | Revenue may fall while building and staffing costs remain | Classrooms, teachers, buses, and facilities may be stretched |
| Main planning risk | Cutting capacity too fast or waiting too long to address a lasting decline | Building too slowly, overcrowding schools, or making costly short-term fixes |
| Possible responses | Rezone, share services, repurpose buildings, or consolidate programs | Add classrooms, recruit staff, adjust boundaries, or build facilities |
| Data to examine | Births, moves, transfers, participation, grade cohorts, and funding rules | Housing growth, births, incoming transfers, grade cohorts, and capacity |
| Student impact to watch | Longer travel, loss of a neighborhood school, staff turnover, or reduced programs | Overcrowding, larger classes, waitlists, and pressure on support services |
| Better measure of success | Stable, accessible education with responsible spending | Adequate capacity, sound staffing, and manageable class sizes |
Growth is not automatically good news, and decline is not automatically proof of failure. A growing district can have overcrowded classrooms and a shortage of experienced teachers. A shrinking district may have an opportunity to reduce class sizes or improve access—if funding and staffing are managed wisely. The comparison is useful because it exposes a common mistake: treating enrollment as a contest in which more students always mean success and fewer always mean collapse.
The real competitor for a district’s attention is often not another school system. It is a budget built on assumptions that do not match where children actually live. A district that uses old housing projections, ignores transfers, or assumes every lost student has the same cost can make poor choices in either direction. Local data should be published by grade and school, with clear notes about boundary changes and counting methods. Without those details, a comparison table can create the appearance of precision while hiding the important differences.

Common Misconceptions and What to Know
Misconception 1: Every district is losing students. No. The national story is uneven. Some districts have experienced declines; others have regained students or grown. Even within one district, an elementary school may shrink while a nearby secondary school grows. NCES national totals help describe broad patterns, but local data are essential before drawing conclusions about a particular community.
Misconception 2: A lower public-school count means children have disappeared. Not necessarily. Some children may have moved, changed school type, transferred across district lines, or been counted differently. Census and education statistics measure related but distinct things. A district should identify what it knows—and what it cannot infer—before assigning a cause.
Misconception 3: The pandemic explains everything. The pandemic disrupted attendance and enrollment, especially around 2020, but it cannot explain every later decline. Birth cohorts, housing, work patterns, migration, and school choice matter too. If a district’s kindergarten classes were already getting smaller before closures, the pandemic may have intensified a trend rather than started it.
Misconception 4: Fewer students mean costs fall at the same rate. They do not. A district cannot close half a boiler or run half a bus route. Buildings, transportation networks, contracts, special education, and minimum staffing levels create fixed or semi-fixed costs. Savings often depend on difficult changes and may arrive later than the enrollment loss.
Misconception 5: Closing a school is the obvious financial fix. A closure can reduce operating costs, but the net savings depend on building condition, transportation, staffing, maintenance, and what happens to the site. Moving students may require renovations elsewhere. The choice also carries human costs that a financial estimate should acknowledge rather than hide in a footnote.
Misconception 6: The state or federal government will automatically fill the gap. Public education funding is divided among local, state, and federal sources, and the rules vary. Federal aid may be targeted or temporary. State formulas can cushion losses, but local districts cannot assume that another level of government will replace every dollar. The relevant documents are the actual state formula and district budget—not a general claim about “school funding.”
Frankly, the biggest error is confusing a trend with a policy conclusion. A falling count tells a district to investigate. It does not, by itself, settle whether a school should close, whether a tax proposal is justified, or which programs should be protected. Those decisions require public records, cost estimates, student-impact analysis, and a clear account of alternatives. If officials present only one option, residents are right to ask what was ruled out and why.
Good analysis also asks who bears the burden. A building closure may look efficient at district scale but impose a long trip on young children or students with mobility needs. A staffing reduction may save money while increasing class sizes in the schools that remain. Responsible stewardship means using public resources carefully, not simply spending less; it also means recognizing that children are not movable units on a ledger.
Frequently Asked Questions
Is U.S. public-school enrollment declining everywhere?
No. Enrollment trends vary widely by state, district, and grade. Some communities have reported sustained declines, while others have seen growth or recovery after pandemic-era disruptions. National figures provide context, but a reliable answer for one district requires its own multi-year records, enrollment definitions, and grade-level data.
Why are some school districts losing students?
There is no single explanation. Lower birth rates can reduce the number of entering students; families may move because of housing costs or jobs; and students may attend charter, private, or home schools, or transfer to another district. Pandemic disruptions also changed enrollment patterns. Local data are needed to determine which factors matter most in a particular place.
Does lower enrollment always mean less school funding?
No. The relationship depends on state and local finance rules, the timing of student counts, and other revenue sources. Even when funding falls, many costs—such as building upkeep, transportation, and required student services—do not fall in equal measure. Districts should explain their actual formula and budget rather than assume a fixed dollar loss for every student who leaves.
What should families ask when a district proposes school closures?
Ask for several years of enrollment by school and grade, the assumptions behind future projections, the full cost and savings estimate, and the effect on travel time, class size, special education, and access to programs. Families should also ask what alternatives were considered, how student safety will be protected, and how the board will review the decision after implementation.
Final Thought
Beth Doglio’s quoted observation captures a concern shared by communities confronting lower student counts: a district may be dealing with a trend that reaches beyond its own borders. But a quote without a date or location cannot establish the scale, cause, or policy consequence of that trend. Those details have to come from enrollment records, finance rules, and the voices of families who will live with the decisions.
School boards should neither panic at a one-year dip nor bury a multi-year decline beneath optimistic projections. They should publish the evidence, show their calculations, and state plainly which assumptions remain uncertain. If enrollment is falling, parents deserve to know whether students have moved, changed schools, or were counted differently. Staff deserve honest notice. Taxpayers deserve a budget that explains what each option costs. And children deserve decisions that protect the quality and accessibility of their education, not merely the neatness of a spreadsheet.
I have found that the strongest reporting on this issue resists easy villains and easy fixes. Districts do not control every birth trend, housing shift, or family decision; they do control how clearly they explain their response. A community may ultimately need to consolidate buildings or change programs. If so, the process should be transparent, the burden should be fairly shared, and the students with the fewest alternatives should not be treated as an afterthought. Public education is a public trust. Managing it well requires sound arithmetic—and a steady regard for the people behind the numbers.